Building an RCA Agent with Amazon Bedrock AgentCore
The companion to my AWS Community Day Central Asia talk: how one question, "why is this pod restarting?", grows from a single model call into a bounded investigation agent, what it takes to run one, and where Strands and AgentCore fit.
Viktor Vedmich · 15 min read
It is tournament finals night. Matchmaking starts returning errors, the pager goes off, and the first question in the incident channel is the one it always is: why is this pod restarting?
You know what happens next, because you have done it. You open the alert. You run kubectl describe on the pod. You jump to CloudWatch for the logs, to Prometheus for the memory graph, to the wiki for the runbook somebody wrote last year. One incident, several systems, and the real work happens in your head: connecting the evidence.
That gathering and correlating is exactly the part a machine can do first. Not a chat assistant that explains the log you paste into it: that is a copilot, and a copilot answers. What I want at 2AM is an agent. An agent chooses the next check, calls the systems itself and hands me a report with the evidence attached. A copilot answers. An agent investigates.
This post is the written version of my talk on building a root cause analysis (RCA) agent at AWS Community Day Central Asia 2026 in Tashkent. It follows the same route:
- What capabilities does an agent need?
- What does it take to operate one?
- How do Strands and AgentCore help?
- How do we build our own RCA agent?
The full deck is online, and its slides are embedded throughout, so you can click through the diagrams yourself. The recorded demo is near the end.
One question, five layers
The clearest way I know to explain an agent: take one question and keep answering it, adding one capability at a time. At each step, look at what the answer can and cannot do. (The answers and values below are illustrative and synthetic, as they were on the slides.)
A model alone: plausible and generic
Ask a generative model “why is this pod restarting?” and you get a good answer to a different question. Common causes: the container ran out of memory (OOMKilled), the process crashed on start, a liveness or startup probe is failing, or the config or image is bad. Run kubectl describe pod and check the last termination reason.
That is useful general advice, and at 2AM it explains nothing. It could be any pod, anywhere. The reason is mechanical. A model predicts the next token from what is in its prompt. Its knowledge stops at its training cutoff, it has no memory between calls, and it has no access to your cluster. Context is the only channel into the model. Everything that follows is a way to put better things into that channel.
Add our knowledge with RAG
Retrieval-augmented generation (RAG) puts our own documents into the prompt. The question is used to search an index of our runbooks, and the best matching passages, with their source, are added to the context.
The answer changes: “Your runbook lists match-api memory limits as a known risk. Check the last termination reason and compare memory usage against the configured limit for the incident window.”
Now it is grounded in our knowledge. But notice what is still missing: nobody has looked at the pod. Retrieval finds text. It does not observe anything.
Add live tools through MCP
This is where it starts to feel different. With tools, the model can ask for an observation. Through the Model Context Protocol (MCP), the application offers the model a list of tools such as eks_describe_pod. The model proposes a call, and the application runs it.
The context now contains a tool result (synthetic, like every value here): last termination OOMKilled, exit code 137, memory limit 512Mi. And the answer is finally about this pod: “The previous container was OOMKilled (exit 137) against a 512Mi limit. Next check: the memory working set for the last hour and the deployment history. Not yet established: why memory grew.”
One detail on this slide matters more than anything else in the first half: the model proposes the call, the application makes it. The model never touches your cluster. Your application checks the policy, calls the MCP server and returns the observation. Permissions live in code and configuration, not in the model’s good intentions. (If MCP is new to you, start with MCP servers, plainly explained.)
Let the loop choose the next check
A tool call gives the model one observation. The agent part is the loop that uses it. Look at the evidence so far, choose the next check within the allowed scope, call a scoped tool, look at the observed result, then decide: retry, check something else, or stop.
Two properties keep this loop under control. It is bounded: the application, not the model, enforces limits on tool calls, time and tokens, and when a limit is reached the agent stops and says what it could not establish. And only an observed result can trigger another check, an error included. The loop moves forward on evidence, not on the model talking itself into something. Permissions and untrusted content need their own controls, and they come up below.
Not everything needs to be an agent
The advice from the talk that I would give any team: let the task decide. A workflow is fixed steps in code. It is predictable, cheap and testable. An agent lets the model choose the next step, and you pay for that in latency, cost and a much wider range of ways to fail.
In the RCA design, only the investigation itself is agentic. Alert intake is a fixed workflow with a fixed webhook schema. The tool contracts are read-only. Remediation is gated by a person. Keep the agent for the open-ended part and keep everything around it deterministic.
Skills and subagents, when you need them
Two more capabilities complete the picture.
A skill is a reusable procedure for a recurring job. “Restart investigation” says when to use it (a container restart, not every Kubernetes question) and how to proceed: inspect the previous termination state, align metrics with the restart time, compare plausible causes, report the evidence and the missing checks. The skill is loaded into the prompt when the job matches. Skills provide instructions. Tools provide capabilities.
A subagent gets a bounded task in a fresh context. The investigator’s context fills up fast: the question, pod state, runbook passages, ten screens of logs and metrics. Handing “look at memory around the restart” to a telemetry specialist keeps that noise out. The specialist returns compressed findings, not its transcript. It costs latency, another handoff and several times the tokens of one agent. The reason to delegate is context budget, not an org chart.
This is a capability map, not a mandatory stack. Add a capability when the task needs it. The prototype I showed uses the model, RAG and MCP tools in a loop. Skills and subagents are where it can grow, not where it starts.
Running it is the hard part
Everything so far fits on a whiteboard. Then you try to run it for a real on-call rotation and find out that the loop is only part of the application. A working agent needs an operating environment: where it runs, who may call which tool, what must be blocked, what survives between runs, which prompt version is live, and what happened and why.
Four of these deserve a closer look.
Three access decisions, not one
A login answers only the first question: who may invoke the agent? The second is what the agent may do with its tools. Inspect one workload: yes. Change an alarm: no. The third is the one people skip: content. Logs are untrusted input. Anyone who can write a log line can write text that ends up in your model’s context. Treat content as evidence, never as authority.
This RCA agent has all three ingredients that make an agent risky: private data (the cluster), untrusted content (logs) and a way out (the report). So each boundary has to be explicit, in configuration you can test. Writing “be careful” in a prompt replaces none of these decisions.
Memory has three lifetimes
“Memory” means three different things. The conversation lives until the investigation ends. The investigation record (what ran, its status, where the report is) must outlive the session, because someone will look for it tomorrow. And reviewed incident knowledge, after a person has confirmed the outcome, can become a lead for the next incident. A lead to check, not a cause to trust. Canonical logs and runbooks stay in their own stores, so reused context can always be checked against the source.
A prompt edit is a release
Change one instruction and you have changed the system. The example from the slide: a new instruction makes the agent recommend more memory before it reads the container state. Every response is still valid. The investigation got worse.
So prompts get the same treatment as code. Version the prompt, the tools and the model together. Evaluate by replaying past incidents. Promote with a rollback path. Every report carries the version that produced it, so when two reports disagree you know what changed. A platform can help you evaluate behavior. The release decision stays yours.
Three records answer three questions
When something goes wrong you will ask three different questions, and each needs its own record. Who called which API, and when? That is the audit trail. Which steps ran, failed or took time, and did the diagnostic step run at all? That is execution tracing. What did the model actually receive and return? That is captured content. None of them alone answers every question, and access, redaction and retention are decisions you make for each one up front.
Where Strands and AgentCore fit
Now map those requirements to AWS. Two pieces do the work: Strands Agents, an open-source SDK from AWS (Python and TypeScript) that runs the agent loop in your application code, and Amazon Bedrock AgentCore, a set of services for running agents in production.
Strands is pleasantly boring. An agent is a model, a list of tools and a system prompt:
return Agent(
    model=self._model,
    tools=tools,
    system_prompt=system_prompt,
)
AgentCore covers the operating environment:
- Runtime hosts the agent: the execution environment and the session lifecycle. Your entrypoint accepts a request, runs the Strands loop and returns the report.
- Gateway exposes the tool servers to the agent as MCP tools: one place for tool discovery and calls.
- Identity answers “whose authority?”: who the caller is on the way in, and which credentials go out to the tools.
- Policy checks tool calls on the Gateway path. Policies are written in Cedar and enforced default-deny, so “may inspect, may not change” is configuration you can test, including the calls that must be denied.
- Memory can hold reviewed incident knowledge for optional retrieval.
- Observability and Evaluations give you traces per investigation and a way to score behavior before a release.
The footnote on that slide is the part I care about most. Still yours: prompt versions, the durable job record, evaluation cases and the release decision. A platform gives you the controls. It does not make the decisions.
Three notes from building on it.
The session is not your job record. Runtime manages sessions, but the investigation record (status and report, findable after the session ends) belongs in a store your application owns. Retries and duplicate alerts are your decisions too. A session does not make them for you.
Memory stores leads, not truth. Today the prototype retrieves runbooks. Recalling past incidents is a planned extension, not built yet. In that design, a reviewed incident outcome would go into long-term memory through IngestData, the direct ingestion API that AgentCore Memory gained in September 2026. The configured extraction strategies would process it asynchronously, and a later investigation would retrieve the resulting records within its own scope. If ingestion fails, inspect the failure before you redrive it.
Observability is three switches, and you have to flip them. The three records map to three AWS features. AWS CloudTrail records API audit events, but not all of them by default. Bedrock model calls such as InvokeModel and Converse arrive as management events. Calls to AgentCore Runtime, Gateway and Memory, and Knowledge Base retrievals, are data events, and those you have to enable explicitly.
The second switch is in your code: instrument the application to emit OpenTelemetry traces, and AgentCore Observability stores the traces, spans and metrics in Amazon CloudWatch.
The third is Amazon Bedrock model invocation logging, which captures model inputs and outputs to CloudWatch Logs, Amazon S3 or both. It is disabled by default. Three records, three switches. And you still compare the diagnosis with the actual observation.
Building the RCA agent
Time for the worked example. The first job is deliberately small: the 2AM pod.
- Gather: pod state, logs, metrics and the applicable runbook.
- Explain: a diagnosis tied to those observations, and what is missing.
- Hand over: the engineer reviews and decides the remedy.
The hypothesis is to reduce repeated evidence gathering, not to replace the engineer.
It is one investigator behind a gateway with four MCP tool servers:
| Server | Question it helps answer |
|---|---|
| EKS | What happened to the pod? |
| CloudWatch | What do logs, alarms and metrics show? |
| Prometheus | How did the relevant metric series change? |
| Knowledge Base | Which runbook applies? |
Around it is an ordinary application. An alert from CloudWatch, Alertmanager or a manual trigger reaches a backend, which normalizes it, stores the investigation and invokes Runtime. The investigator queries the tools and generates the report. The report view stores the result and lets the UI poll for it.
The project is not public, but here are the two excerpts I showed on stage. Assembling the investigator is the standard Strands pattern, with the tools discovered from the gateway:
with gateway_client as mcp:
    agent = Agent(
        model=bedrock_model,
        tools=mcp.list_tools_sync(),
        system_prompt=instructions,
    )
    result = agent(alert_text)
The instructions are short on purpose: investigate the stated workload, collect current observations, explain the cause and the next action, state what evidence is missing.
A tool is just a function with a clear contract. This one exposes pod state, read-only:
@mcp.tool()
@log_tool_execution
def eks_describe_pod(
    pod_name: str, namespace: str = "rca-demo"
) -> dict[str, Any]:
    cmd = ["kubectl", "get", "pod", pod_name,
           "-n", namespace, "-o", "json"]
    result = subprocess.run(
        cmd, capture_output=True, text=True, timeout=30
    )
    ...
It returns the resources and the current and previous container state. The runbook side is one retrieval tool, bedrock_kb_retrieve(query, top_k=3), a thin wrapper around the Amazon Bedrock Knowledge Bases Retrieve API, which returns each passage with its source location and score. Query with the failure mode, get passages from the applicable runbook, then compare that guidance with the current evidence.
What a useful report must show
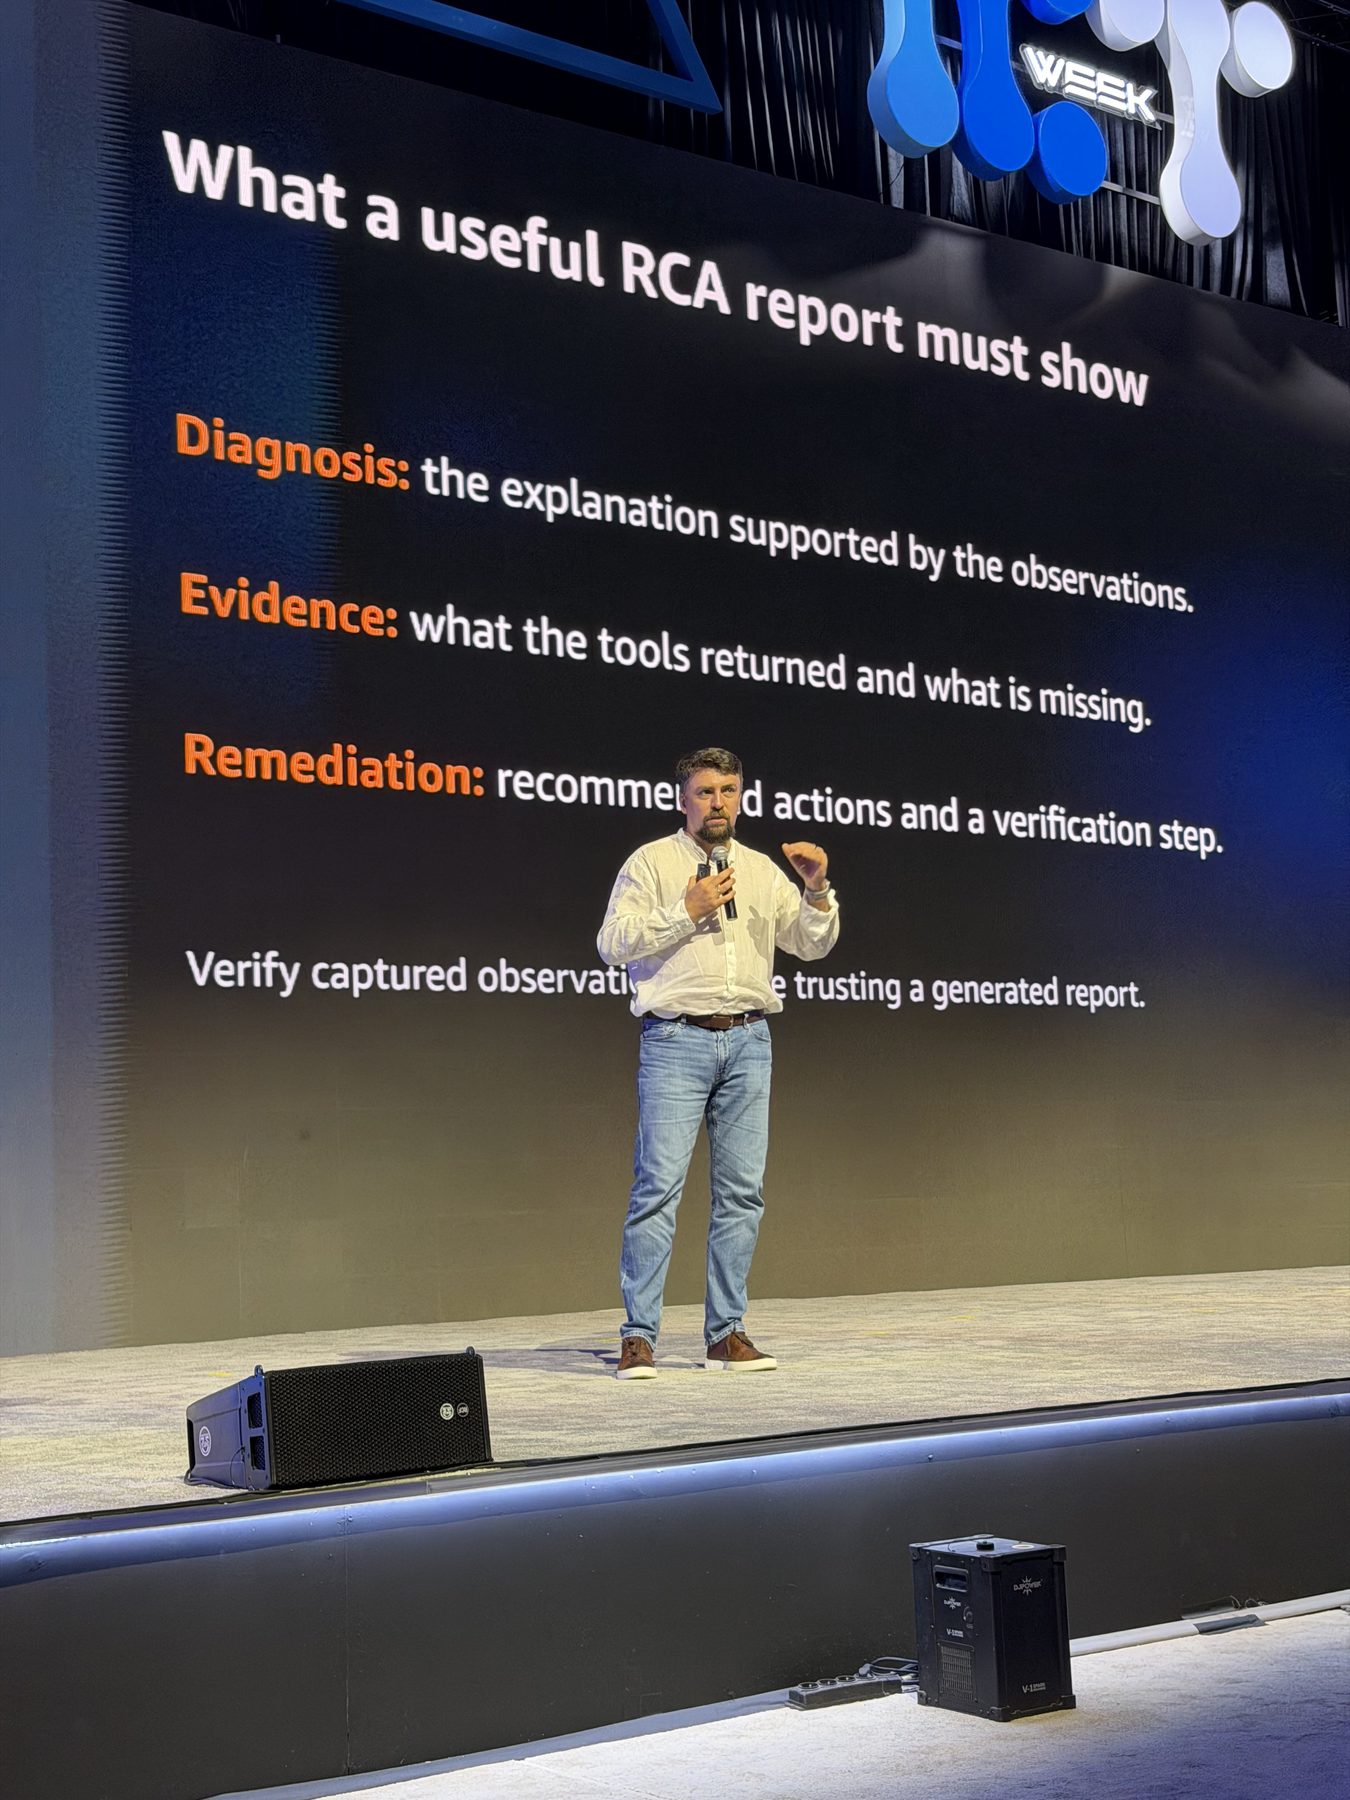
A useful RCA report has three parts:
- Diagnosis: the explanation supported by the observations.
- Evidence: what the tools returned, and what is missing.
- Remediation: recommended actions and a verification step.
And one rule: verify the captured observations before you trust a generated report. The evidence is the product. The prose around it is packaging.
The demo
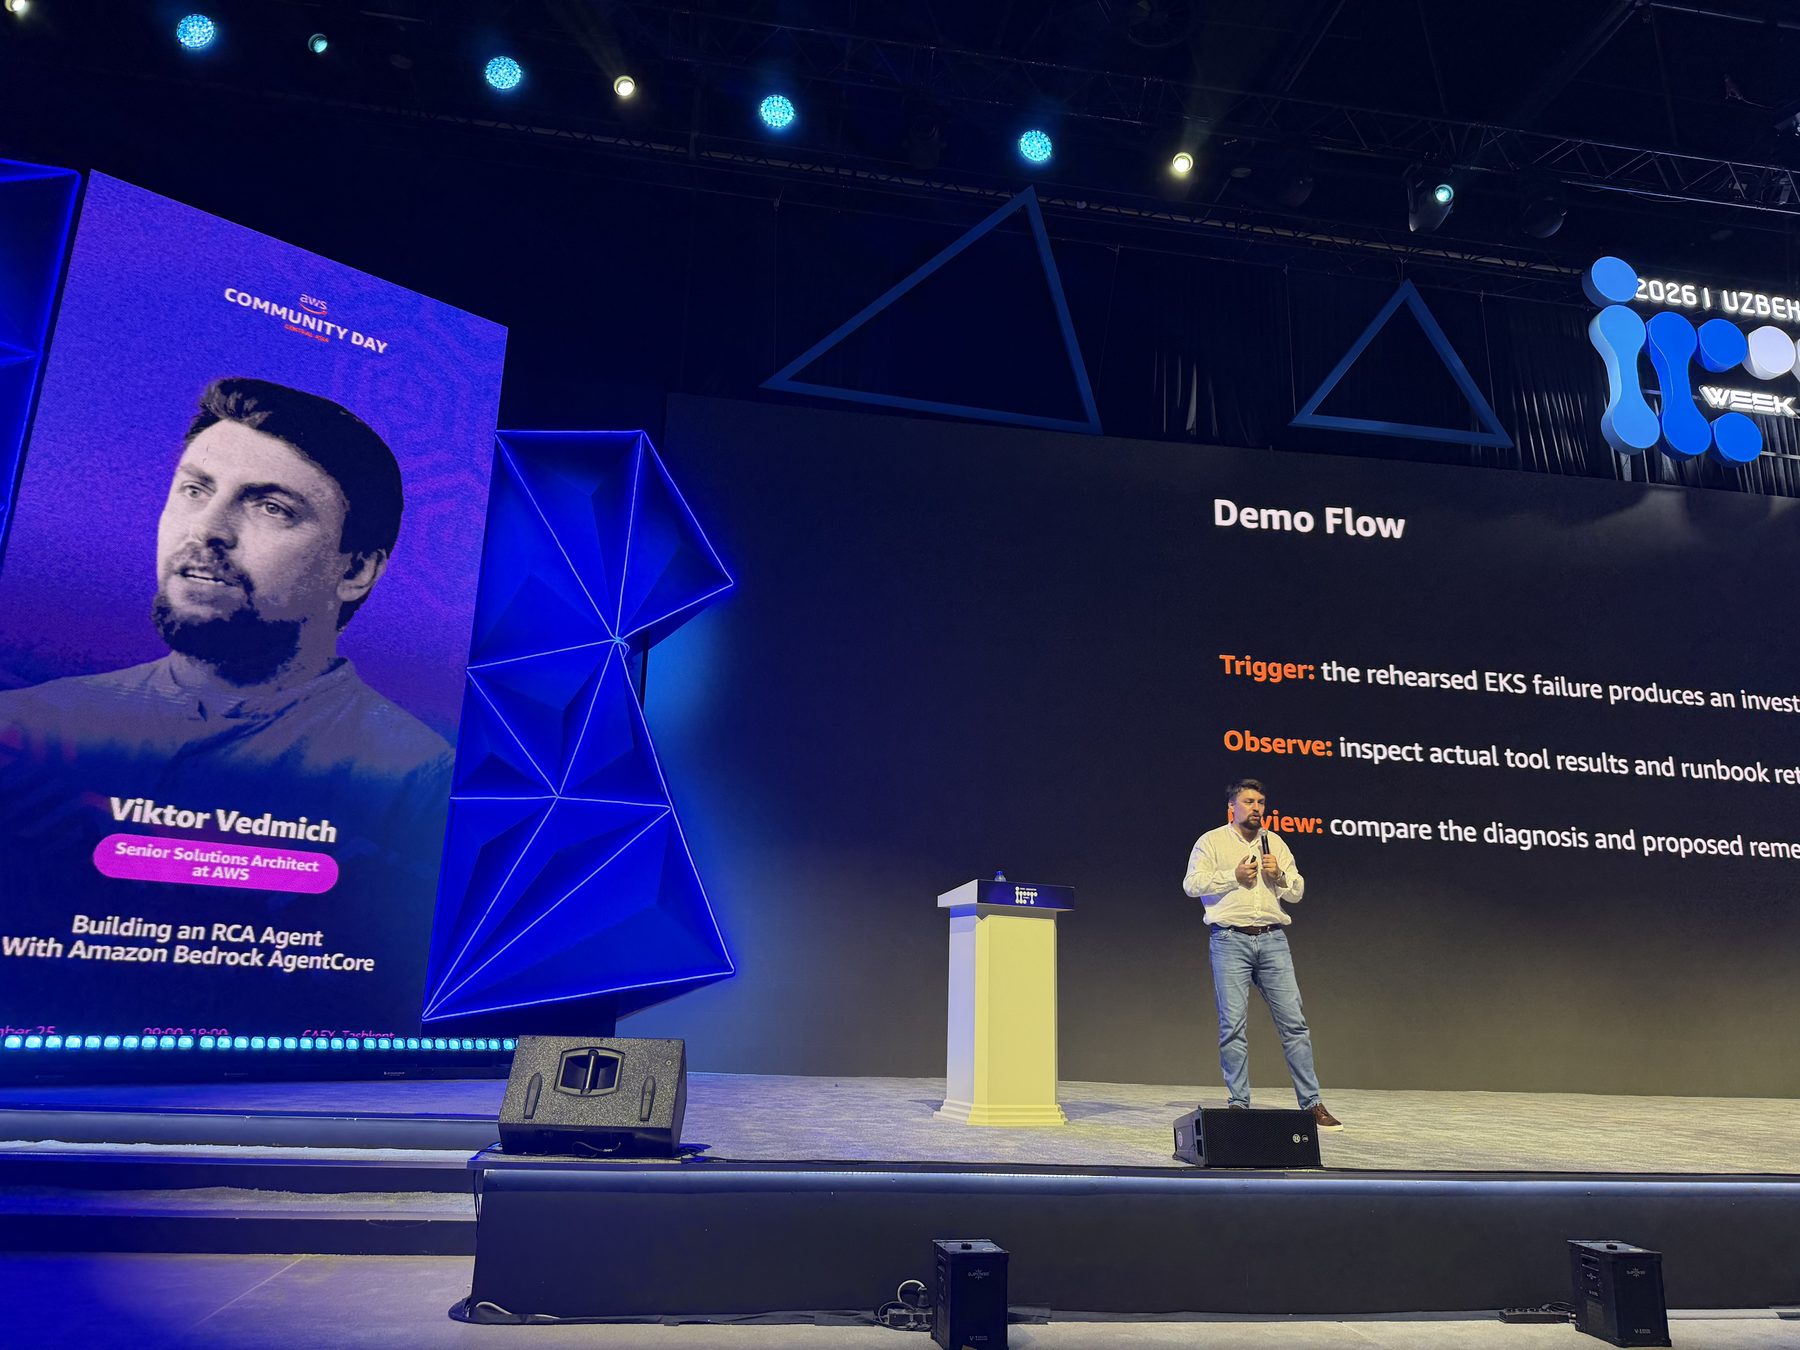
The demo had three steps. A rehearsed EKS failure triggers an investigation. We inspect the actual tool results and the runbook retrieval. Then we compare the diagnosis and the proposed remedy with the evidence. Here is the recording I played in the room (2:49):
Build or buy?
You do not have to build this. AWS DevOps Agent gives you managed incident investigation and mitigation plans. Actions that change resources (directed actions) are off by default, and each one needs operator approval when it runs. AgentCore Harness gives you a configured agent with a managed loop, which you can export to Strands code later. A custom Strands loop gives you your own tool contracts, runbooks, report shape and action boundary.
My rule of thumb from the talk: build when the telemetry, the runbooks or the action boundary are specific to you. Otherwise, start managed.
What I learned
Three things I would take back to the team:
- Build around a job. A useful first agent is small. In the talk: one investigator, four tool servers, one recurring question.
- Make the evidence inspectable. The report shows its evidence: the termination reason and the limit, the cited runbook passage, and what could not be checked.
- Operate it as software. Version, observe, evaluate: a version on every report, traces per investigation, replay before release.
And one habit for the on-call rotation: form your own hypothesis before you read the agent’s findings. The agent saves you the gathering. It should not replace your judgment.
The day in Tashkent
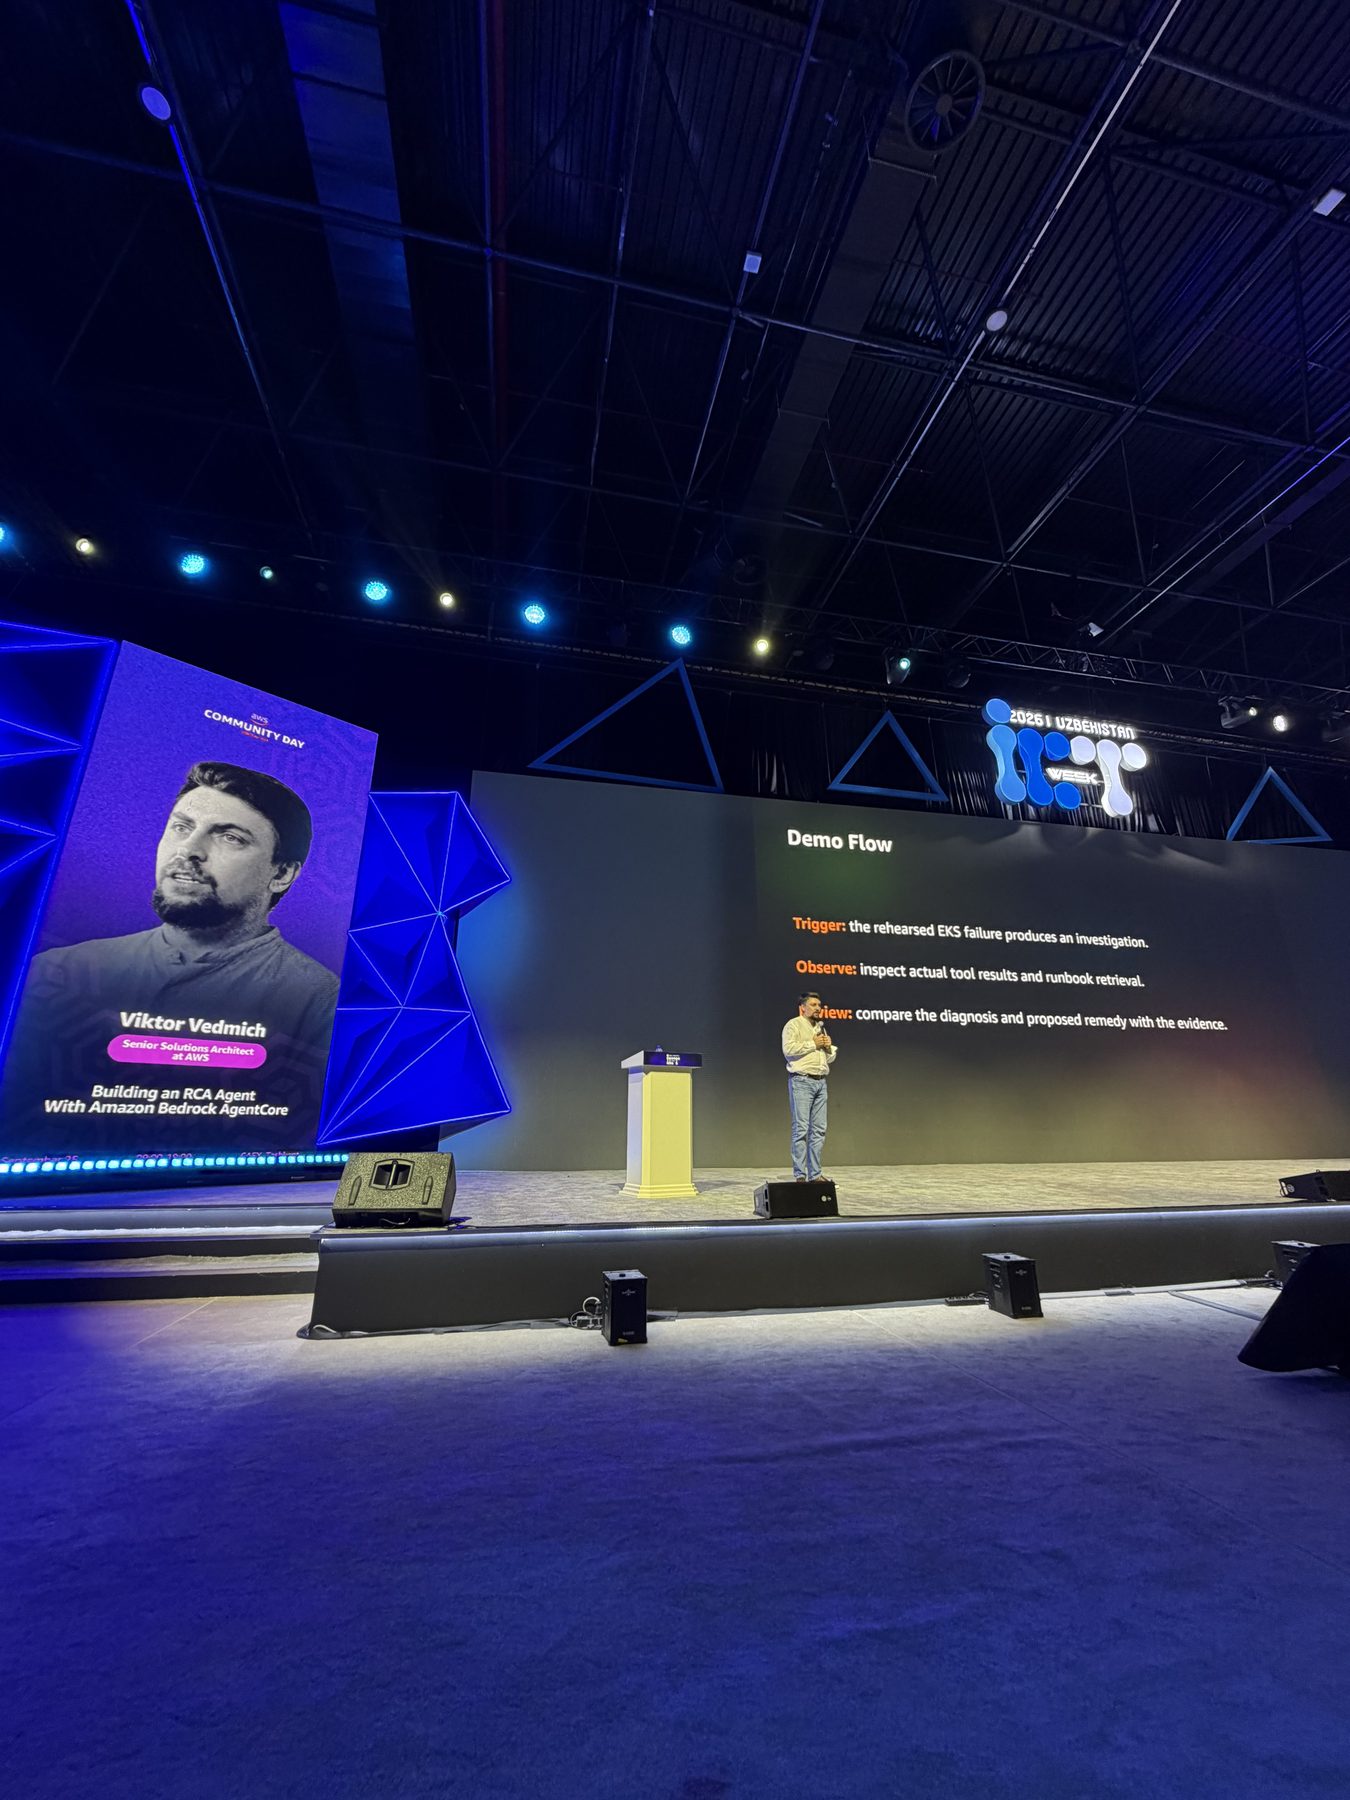
AWS Community Day Central Asia 2026 took place on Friday, 25 September, at CAEx in Tashkent, on the last day of ICT Week Uzbekistan. It was hosted by the AWS User Group Tashkent, with support from the user groups in Kazakhstan and Kyrgyzstan, and opened with Jeff Barr’s keynote “Adapting to Change”. My session was at 10:15. Thank you to Shakhzod Khodjaev, Taras Tereschenko and the whole organizing team for a great day.
I closed the talk with a question, and it is still the one I would ask you: what would your first agent investigate?
Related
- Slides: Building an RCA Agent with Amazon Bedrock AgentCore, the full deck (52 slides, recorded demo on slide 44).
- Recording: the full-day livestream on the AWS User Group Uzbekistan channel. My talk starts at about 1:15:00.
- Talk page: Building an RCA Agent at AWS Community Day Central Asia.
- Background: MCP servers, plainly explained.
Sources
AWS, Strands and MCP statements checked against these official sources on 2026-10-03.
- What is Amazon Bedrock AgentCore? and how AgentCore Runtime works
- AgentCore Gateway and AgentCore Policy
- AgentCore Memory direct ingestion (IngestData)
- AgentCore Observability and AgentCore Evaluations GA
- AgentCore Harness
- AWS DevOps Agent: directed actions
- CloudTrail logging for Amazon Bedrock and Bedrock model invocation logging
- Knowledge Bases Retrieve API
- Strands Agents: MCP tools
- MCP specification: tools